S&P data from around the world delivers another crushing blow to active management.
Most investors we work with care very little for the nuances of investment management. However, they do care about their goals, and they trust us to allocate to an appropriate portfolio to achieve those goals. Occasionally, however, we like to inform our clients about why we have the investment philosophy we subscribe to, and the difference we think that makes for them.
One tenet of our philosophy is that we don’t use investment managers that do the following:
1. Believe they know more than markets and concentrate portfolios into a few selections
2. Try to time when to get in and out of markets
3. Charge high fees commensurate with their claims about skill
You might classify managers that do these things as ’active’. They either work for fund companies or brokers, but they all tend to employ at least one of the approaches on the list above. You might be thinking, why not try to time markets? Why not concentrate my portfolio into the investments I think are likely to beat the market?
Of course, some who manage funds in this manner have achieved high returns, so it may seem logical to at least try and replicate their success. However, you might be surprised to know there is overwhelming evidence which shows attempts to manage investments in this way does not work for most investors.
When measured objectively, managers that use these techniques have lower returns than a comparative market benchmark, on average. In addition, while that’s typically true over one year periods, it is almost always true over 10 to 15 year periods.
Standard and Poor’s (S&P) is one of the best places to find this evidence. Every year they measure the returns of active managers against an appropriate benchmark, and publicly share the results. The chart below shows the percentage of active managers that outperform their market benchmark, across a number of different countries.
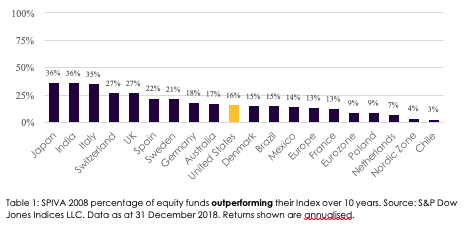
Past performance is no guarantee of future results. SPIVA report underperformance, Consilium has taken the inverse which is outperformance for this illustration. Table is provided for illustrative purposes.
Looking at the chart above, 16% of US actively managed funds had returns better than their comparative benchmark. We highlight the US in yellow, as some claim active management doesn’t work in the US only because it’s such a competitive market, but that active management will work better in smaller markets such as New Zealand.
This claim, however, is debunked by the data. Indeed, the US is a competitive market, but in other less competitive markets such as Mexico, Poland, Brazil and Chile, active managers do even worse than in the US. As the graph shows, the US is just in the middle of all countries where this analysis is carried out. The fact is, in every single country analysed, the average returns of active managers are lower than their local market benchmarks. We have no reason to expect New Zealand would be any different.
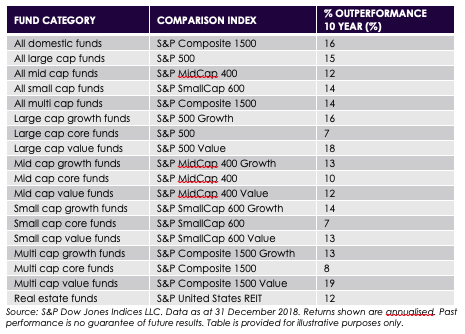
This is also true for different styles of investing. It doesn’t matter if you are investing in large companies, small companies, inexpensive (value) companies, or even expensive (growth) companies…the average active manager does worse than the market in which they invest.
Take a brief look at the US market cut 18 different ways. The results are the same.
Table 2: SPIVA 2018: Percentage of US equity funds that outperform their benchmarks.
So, what does this mean for you?
Well, it means a lot. Looking at the SPIVA 2018 US data, the average fund underperformed its benchmark by 1.43% over the last 15 years.
Table 3: SPIVA 2018 average US equity fund performance (equal-weighted)
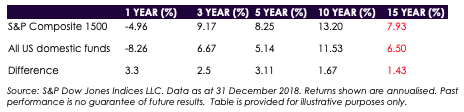
1.43% is a large amount. Let’s say that you invested $1,000,000 15 years ago. Forgetting taxes and other fees, let’s say you got the return of the market listed above. Your friend got the average return of active managers, which is 1.43% less. How much more would you have now compared to your friend?
Answer: $570,000
That’s a figure that matters. This isn’t just an academic issue with no relevance to you. This is a critical issue with real meaning for your future. What could you do with an extra $570,000? A lot, and that’s the point.
What do you have to do to earn that extra return? You have to do something very simple and very hard. You need the discipline to ignore the chatter, marketing, media and noise from investment managers; those touting their recent (read, one year, three year or five year) track records and performance, and the promise of the riches they will bring if you simply switch your portfolio to them. You also need to ignore the relentless headlines predicting doom and gloom and stay disciplined in the markets. The last 15 years in this example include the years 2004 – 2018. That period wasn’t exactly the easiest one in which to stay invested.
Few investors have either the correct information or the discipline to ignore the chatter and stay invested so they don’t miss out on the available market returns. But we work hard to ensure that you don’t miss out. By avoiding the siren song of the active managers and instead looking ahead with a long-term focus, you can get the returns you deserve.